According to a 2019 report by the SDG Knowledge Hub (https://sdg.iisd.org/), about 95% of products worldwide undergo chemical processing. Therefore, the chemical industry is extremely important to Taiwan, which focuses on manufacturing and exports, and it plays a crucial role in achieving Taiwan’s 2050 net zero carbon emission goal.
To effectively move toward the net zero carbon emission goal, companies or industry organizations should establish best-practice guidelines for energy saving as a reference for industrial enterprises.
As a pump manufacturer, ASSOMA provides energy-saving recommendations for pump systems.
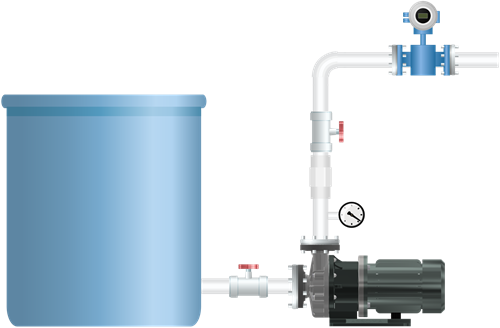
A simple pump system can be divided into the pump, motor, piping system, flow/pressure instrumentation, and control system. Below, we explore how to improve system design to achieve energy savings.
(1) Electric Motor
We are generally familiar with electric motors. According to IEC 60034-30-1:2014, motor efficiency is classified into IE1–IE4.
The following (Table 1) shows an example of a 2-pole, 4 kW, 50 Hz motor:
Table 1:2 pole, 4 kW, 50 Hz Motor Efficiency | ||||
Grade | IE1 | IE2 | IE3 | IE4 |
Efficiency | 83.1% | 85.8% | 88.1% | 90.0% |
Some older pumps may still be equipped with IE1-grade motors. Upgrading the motor to the standard IE3 grade available on the market can improve efficiency by about 5% as shown above. Considering that the motor may not always operate at its best efficiency point, we can still expect around a 3% reduction in motor energy consumption.
(2) Pump Efficiency
Similar to electric motors, pumps also have corresponding energy efficiency classifications. The European Union directive EU (No) 547/2012 establishes efficiency standards specifically for water pumps. Efficiency is expressed in terms of the Minimum Efficiency Index (MEI), and the regulation defines seven standard levels ranging from MEI = 0.1 to MEI = 0.7. Currently, water pumps sold in the European market must meet an efficiency class of MEI > 0.4. So, how significant is the difference between MEI = 0.4 and the highest MEI = 0.7? We conducted a comparative test using actual pumps:
In this test, we used two pumps with similar performance characteristics. One had an efficiency of MEI = 0.4 (red dashed line), while the other was designed for MEI = 0.7 (blue solid line). Both pumps operated at the same duty point (700 lpm, 20 m). We measured the power consumption of each pump. The results showed that the MEI = 0.4 pump consumed 4.065 kW, whereas the MEI = 0.7 pump required only 3.720 kW to achieve the same operating point — representing a 9% energy saving. Since in most cases the required operating point does not fall exactly near the pump’s best efficiency point (BEP), we conservatively estimate that upgrading to a higher-efficiency pump typically yields about 5% energy savings. | 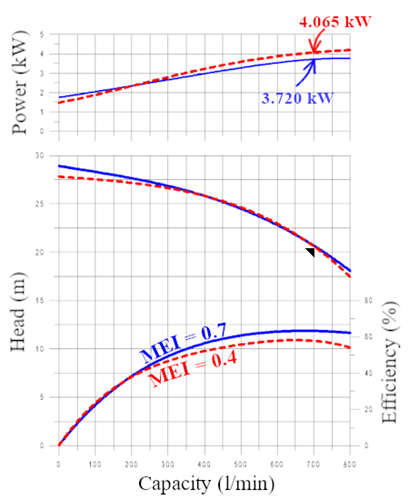 |
(3) Best Efficiency Point and Operating Point
When observing a pump’s performance curve, we can see that every pump’s efficiency curve starts from zero, increases as the flow rate rises, reaches a peak, and then begins to decline. The flow rate at which the efficiency reaches its maximum is called the Best Efficiency Point (BEP).
When evaluating the energy consumption of an existing system, it is helpful to compare the actual operating point with the BEP flow rate. In many older systems, due to various factors such as changes in manufacturing parameters, production capacity, pipeline configuration, or even pump brand replacement, the actual operating point may have shifted away from the original design point. In such cases, the existing pump may no longer be the optimal choice for the current process.
To assess the reasonable range between the operating point and the BEP flow rate, we provide two methods for defining the recommended operating range.
Firstly, we apply the conditions defined in EU (No) 547/2012 for evaluating the MEI (Minimum Efficiency Index). According to this regulation, when determining whether a pump meets efficiency standards, the efficiency at the BEP (Best Efficiency Point) as well as at 75% of the BEP flow rate and 110% of the BEP flow rate must all reach certain efficiency levels. Therefore, defining this range as the recommended operating range ensures that the pump operates at a high level of efficiency during actual operation. | 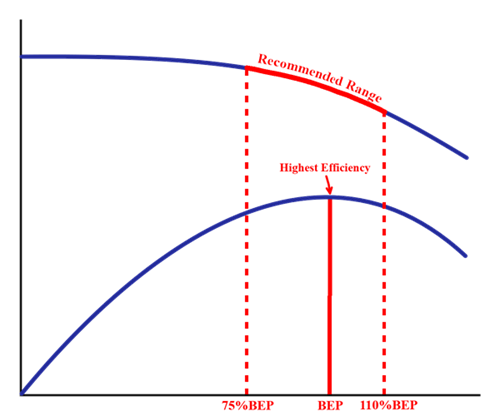 |
The second evaluation method follows the Allowable Energy Consumption Standard for Rotodynamic Water Pumps. Starting from the best efficiency value, it identifies the flow rates on both sides of the BEP where the efficiency drops to 90% of the best efficiency value, and defines this as the recommended operating range. | 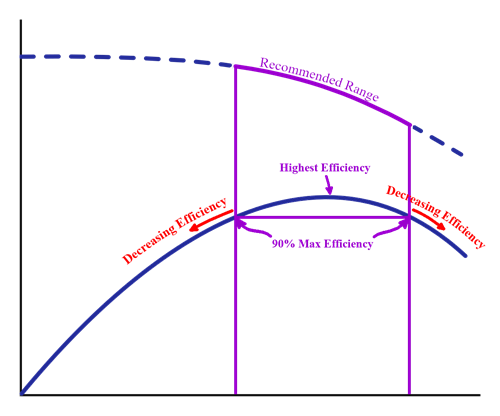 |
The operating ranges derived from both evaluation methods can be used as references.
When the actual operating point exceeds the recommended range, the pump’s efficiency drops rapidly. In addition to higher energy consumption, mechanical wear and tear on the pump will also increase, leading to a shorter service life. In such cases, another pump type or design might be better suited for the process requirements.
We therefore recommend consulting your pump supplier to assess the energy-saving potential and economic feasibility of replacing the pump.
(4) Pump Control Method
In chemical processes, various control parameters such as flow rate, pressure, concentration, and temperature are often required. To maintain process stability, it is common to adjust the circulation rate of the process liquid.
In traditional system designs, electric control valves were typically used to regulate system flow.
However, when the valve is partially closed, it actually increases system resistance and energy loss. When aiming to save energy, any unnecessary loss directly translates into power waste and consequently higher carbon emissions.
The key to solving this energy consumption issue lies in changing the pump control method.
The operating point of a centrifugal pump always lies at the intersection of the pump performance curve and the system resistance curve. For example, in the curve on the right, when the pump operates at 50 Hz (3,000 rpm), the intersection corresponds to a flow of 700 LPM. If the process requires a flow of 600 LPM, we can partially close the control valve, shifting the system resistance curve from “Valve fully open” to “Valve partly open”. The operating point moves left along the 3,000 rpm curve (blue arrow) to the new operating point (blue triangle), with a power consumption of 4.151 kW. The second control method uses a Variable Frequency Drive (VFD) to reduce the speed to 2,570 rpm. The operating point then moves along the “Valve fully open” curve to a new point (purple triangle). At this lower flow and pressure, the required power is 2.856 kW, which is 1.295 kW less than the throttled valve method, achieving approximately 30% energy savings. | 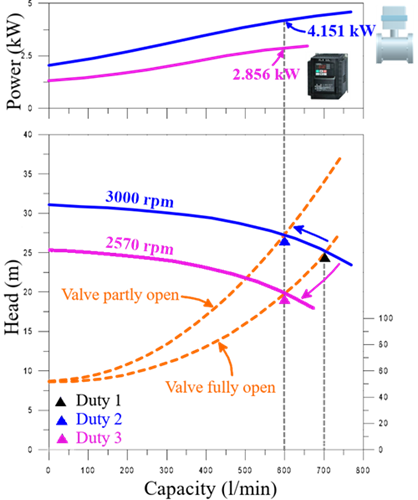 |
Note: The energy savings in this case do not represent all situations. Please consult your pump supplier to assess the energy-saving feasibility for your specific case.
Conclusion
Your existing chemical systems may have significant potential to reduce energy consumption using the methods described above. Customers often hesitate to upgrade or invest in older systems, but if your system is not scheduled for replacement, it can be evaluated from a Lifecycle Cost (LCC) perspective. According to the Hydraulic Institute, electricity costs account for approximately 40% of a pump’s LCC. In the future, besides electricity costs, high carbon emissions may also impact carbon tax liabilities and the cost of purchasing green electricity. | 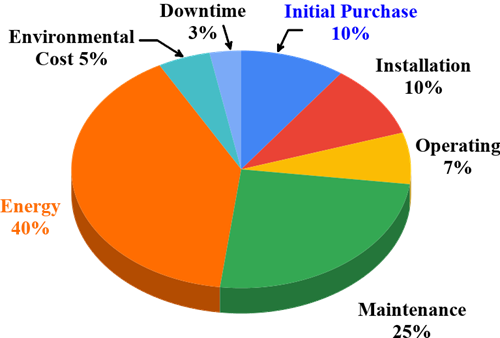 |
References:
https://europump.net/uploads/order forms/LCC_Executive_Summary.pdf
https://www.pumps.org/pump-pros-know-lifecycle-cost-analysis/